As Nancy introduced, this is the second of four posts in our Spring WCTF Blog Series, Achieving Impactful Outcomes: Observations from WCTF. In today’s post Theresa Rowland, Program Director, will discuss what it means to be data-driven.
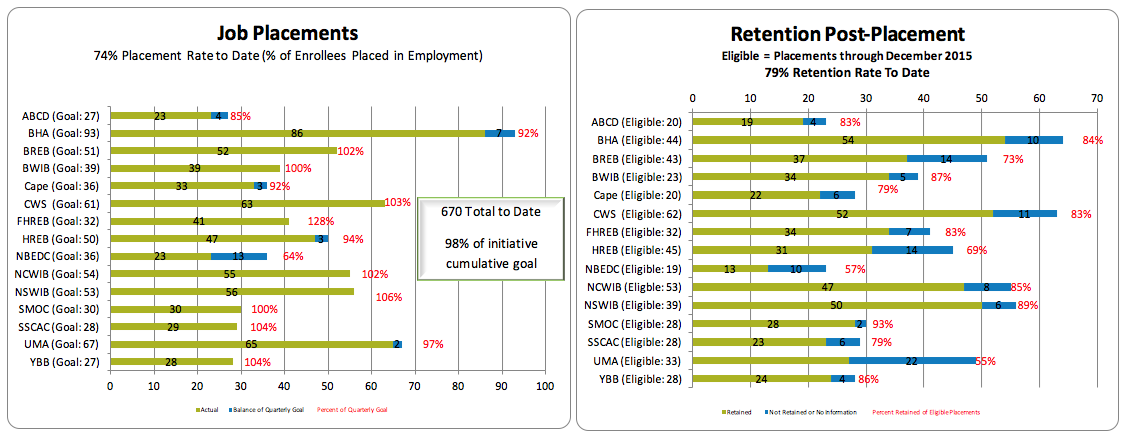
What does data driven-mean? And how do programs ensure they are doing it? To us, data-driven is identifying and using data to help make decisions about the programs we fund. In my 10 years of experience at CommCorp, I have come to learn the value of being data-driven. We ask partnerships to be data-driven from the beginning of any program by engaging employers to identify local real time demand for target occupations. Partnerships are required to talk with employers in their region who are hiring for their identified target occupation, and then learn everything they can about the employers’ skill, credential and hiring requirements. While publicly available data sets are helpful in figuring out which employers to start to talk with, building the case for the demand and need for a training program is only made by talking with real local employers who can provide information on the number of vacancies they currently have, the number they anticipate needing to fill over the next 1-2 years and are committed to partnering to fill their vacancies. We also ask partnerships to continue to be data-driven in managing and measuring the success of their programs. It helps that we are very clear on the goal of sector strategies programs – to place participants in stable positions with opportunities for advancement. Partnerships propose goals and track data using a participant level database for the following indicators:- Primary goal: Job Placement
- Interim indicators:
- Enrollment
- Credential Attainment
- Training Completion
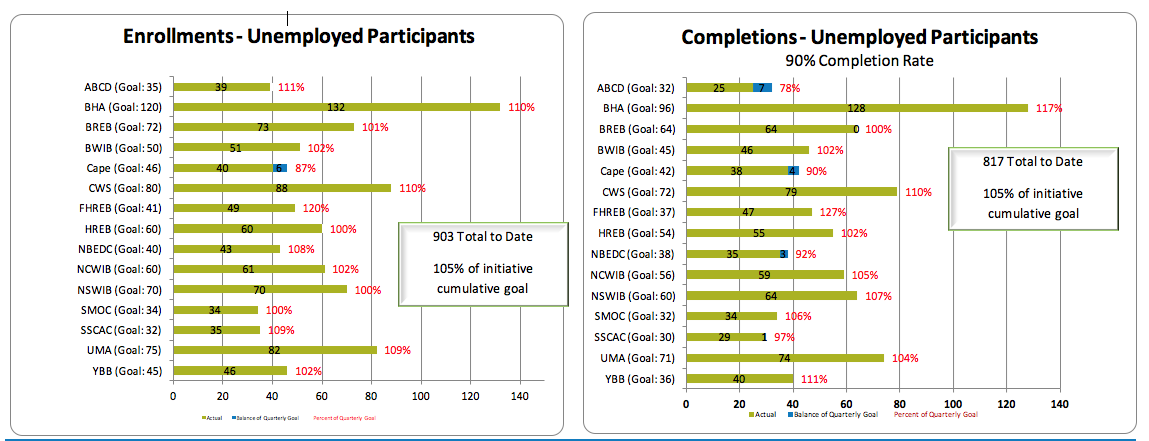 The dashboard does not answer all of our questions, but helps point us in the right direction to start exploring the root cause of the problem and to start identifying mid-course corrections. For example, a low credential attainment rate may point to any variety of issues, including training curriculum that is not aligned to the credentialing exam, significant time lapse between training end date and credential exam or literacy/numeracy barriers. The data alert us to a potential problem which requires additional exploration and conversation to understand.
 Another dashboard used to make program decisions is the demographic report. This helps us understand more about the individuals being served by the programs we fund. We can even look at whether there are certain populations achieving higher rates of employment outcomes by program to help understand any relationship between the demographic profile of an individual and their likelihood of entering employment. This is an important data point to ensure programs are working to support all program participants. For example, if a program was placing a lower proportion of individuals without a high school diploma than individuals with a high school diploma, the program may want to review their selection criteria or design an additional component of the program to provide additional literacy skills to this population.
Data-driven is more than just crunching some numbers. The real fun is using data to point you in the direction toward meaningful conversations with program participants and partners to understand what is really going on in your programs and how to make mid-course corrections to ensure your program meets your partnership’s goals.
Written by Theresa Rowland, the Program Director for Sectoral Employment Initiatives at Commonwealth Corporation. Theresa has worked for the last 10 years making and managing grants through the Workforce Competitiveness Trust Fund.
Another dashboard used to make program decisions is the demographic report. This helps us understand more about the individuals being served by the programs we fund. We can even look at whether there are certain populations achieving higher rates of employment outcomes by program to help understand any relationship between the demographic profile of an individual and their likelihood of entering employment. This is an important data point to ensure programs are working to support all program participants. For example, if a program was placing a lower proportion of individuals without a high school diploma than individuals with a high school diploma, the program may want to review their selection criteria or design an additional component of the program to provide additional literacy skills to this population.
Data-driven is more than just crunching some numbers. The real fun is using data to point you in the direction toward meaningful conversations with program participants and partners to understand what is really going on in your programs and how to make mid-course corrections to ensure your program meets your partnership’s goals.
Written by Theresa Rowland, the Program Director for Sectoral Employment Initiatives at Commonwealth Corporation. Theresa has worked for the last 10 years making and managing grants through the Workforce Competitiveness Trust Fund.